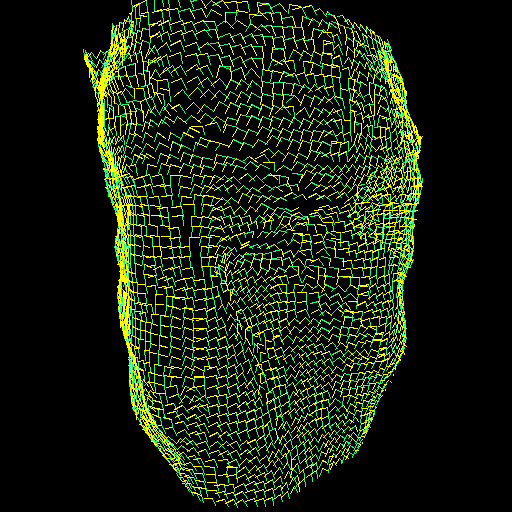
The above graphic represents analysis done on the endocardial wall of the left ventricle of the heart from images generated by the Mayo clinic's Dynamic Spatial Reconstructor. Arrowheads represent directions of principal curvature on the surface of the endocardium. Dark green represents minimum principal curvature directions. Yellow represents the maximum principal curvature directions.
A procedure described in reference 5 of my home page was originally proposed for matching two surfaces with principal curvatures (k1,k2) and (k1',k2') by minimizing (k1 - k1')**2 + (k2 - k2')**2
amini@noodle.med.yale.edu